Antônio R. M. Simões | The University of Kansas
The energy source for most speech sounds is the airstream produced by the lungs. This steady flow of air is converted into brief puffs of air by the vibrating vocal folds, two muscular folds located in the larynx. The source-filter theory of speech production describes how the acoustic characteristics of speech can be understood as the result of a source component and a filter component. In voiced sounds such as vowels and voiced consonants, the vibrating vocal folds provide the source component. How fast the folds vibrate is affected by their mass and stiffness as well as the rate of airflow from the lungs. The rate of vocal fold vibration directly determines the F0 of the waveform which, in turn, is perceived as the speaker’s voice pitch. The mean F0 for adult women is approximately 220 Hz, and approximately 130 Hz for adult men. In addition to their role as properties of individual speech sounds, F0 and amplitude also signal emphasis, stress, and intonation.
The signal generated by the vibrating vocal folds (the source component) has a complex waveform. Its spectrum therefore contains many frequency components. The low-frequency components have a relatively high amplitude; the amplitude of the higher-frequency components gradually decreases as frequency increases. This source signal is then modified by the vocal tract (throat, mouth, and nose) above the larynx, which acts as a filter. Just like the bass and treble settings on an audio amplifier or equalizer, this filter boosts energy in certain frequency regions and suppresses energy in others, resulting in a spectrum with peaks and valleys, respectively. The peaks in the spectrum are known as formant frequencies. The lowest-frequency peak is known as the first formant, or F1, the next lowest is F2, and so on. Figure 1 shows the location of these formant frequencies. The high front tongue position for [i] has filtered the source signal such that frequency components near 350 Hz, 2300 Hz, and 2900 Hz are emphasized. These local frequency peaks are the first three formant frequencies in this production of the vowel [i].

The vocal tract filter is determined by the size and shape of the vocal tract and is therefore directly affected by the position and movement of the articulators such as the tongue, jaw, and lips. In other words, different positions of these articulators will yield different values for the formant frequencies.
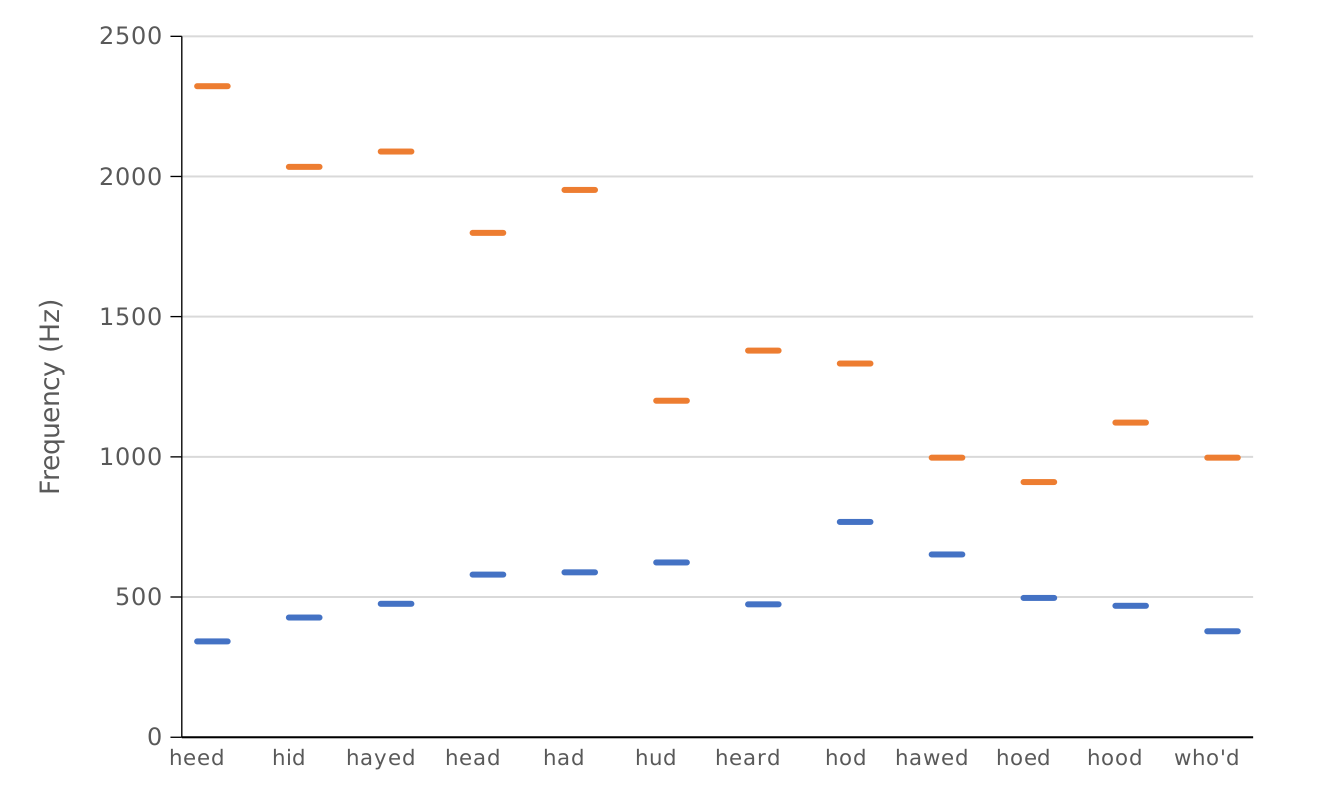
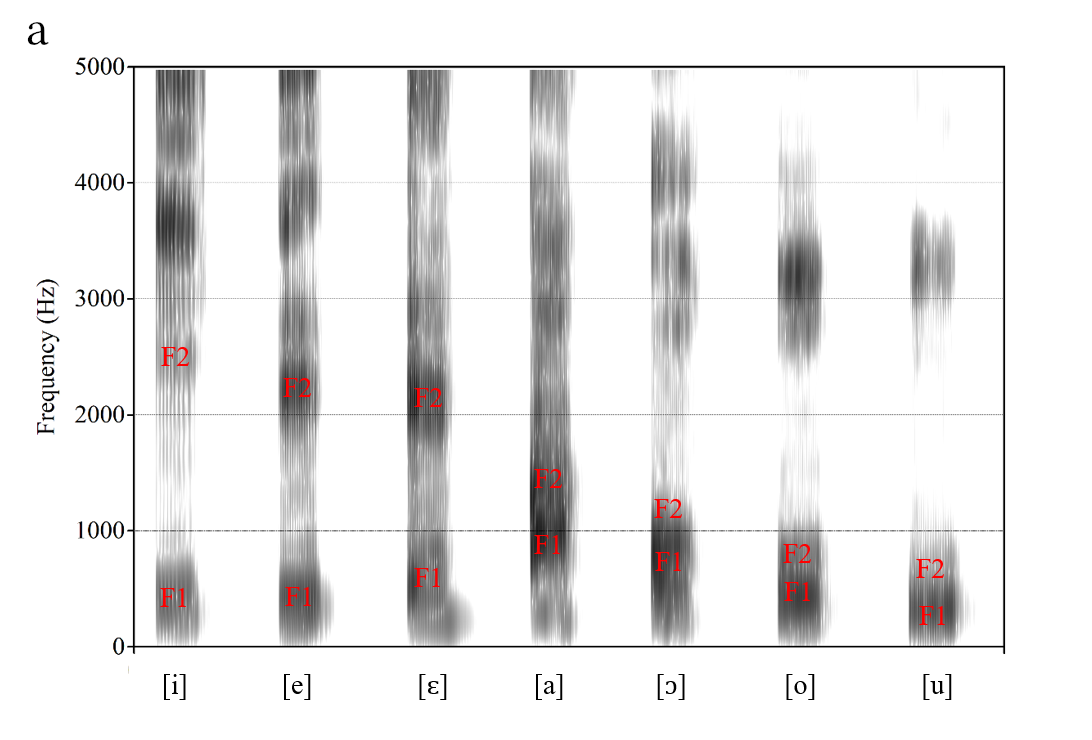
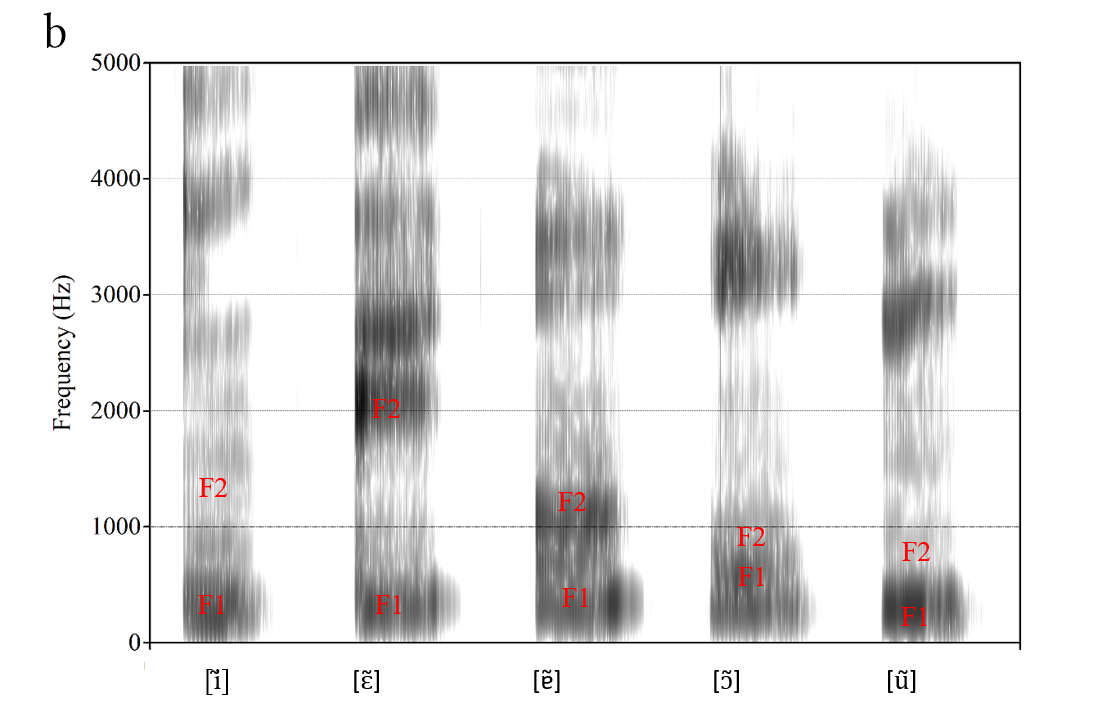
Vowels are typically characterized in terms of the location of the first two formants. In languages that distinguish rounded from unrounded vowels, the third formant (F3) may also provide unique information. Higher formants such as F4 and F5 provide more information about the speaker than about the vowel that was spoken. Figure 2 shows the average location of F1 and F2 for the vowels of American English and Figure 3 shows F1 and F2 for the vowels of one male speaker of Brazilian Portuguese. While Figure 2 shows stylized average values, Figure 3 shows spectrograms for each vowel. Like a spectrum, a spectrogram is a representation of speech. While a spectrum is two-dimensional in that it shows frequency and amplitude, the spectrogram is a three-dimensional representation because it additionally shows time (variations in amplitude are captured by the darkness of the display).
For any given speaker, each vowel typically has a unique formant pattern. However, variation in vocal tract size among speakers often leads to a degree of formant overlap for different vowels. The traditional description of vowels in terms of height and tongue advancement is captured by the pattern of F1 and F2: F1 is inversely related to vowel height, with high vowels such as [i] in ‘heed’ and [u] in ‘hood’ having a low F1 and low vowels such as [æ] in ‘had’ and [ɑ] in ‘hod’ having a high F1. In addition, F2 is an index of the front-back distinction, with front vowels such as [i] and [æ] having a high F2 and back vowels such as [u] and [ɑ] having a low F2.
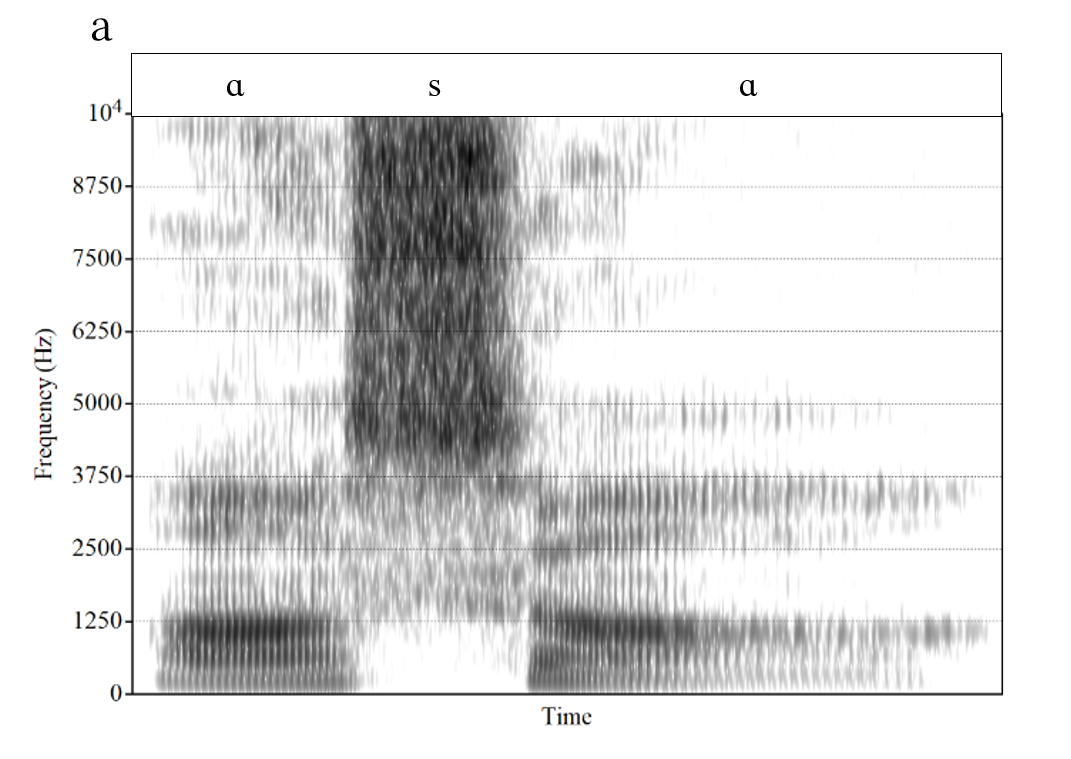
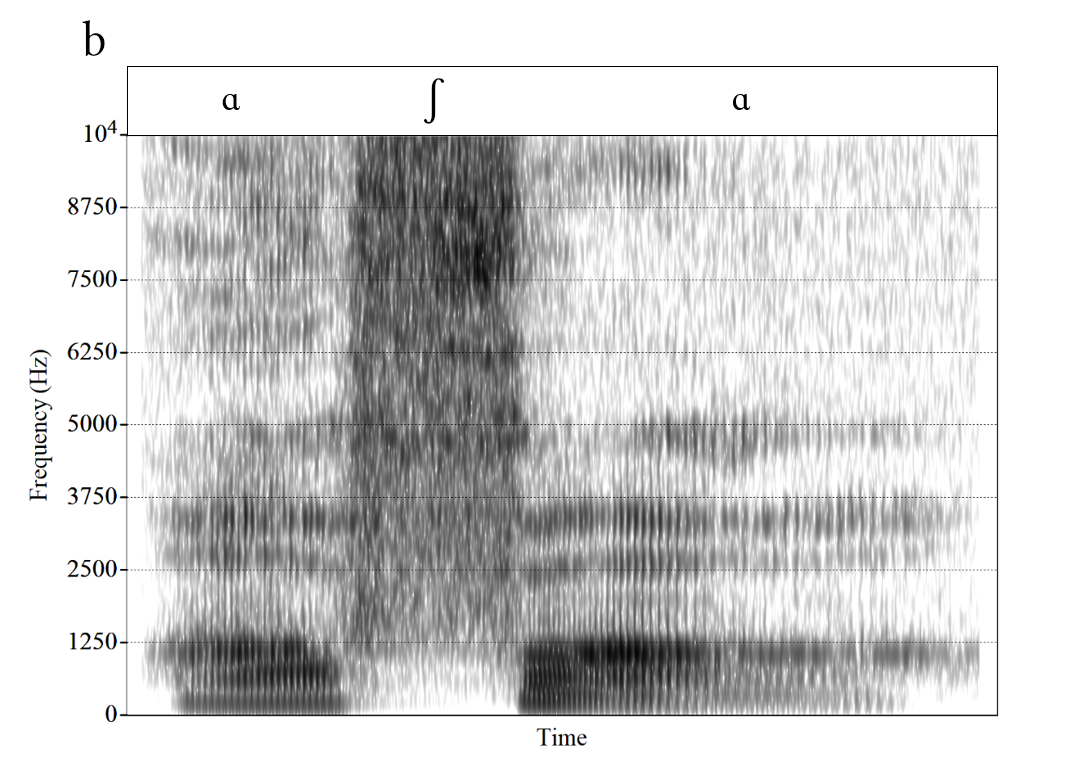
Consonants can also be described in terms of their spectral properties. Many consonants are produced with a complete (e.g., [p, t, k]) or nearly-complete (e.g., [f, s]) constriction in the vocal tract. This constriction divides the vocal tract into two sections: one behind and the other in front of the constriction. For example, in the production of the stop consonant [t], the tip of the tongue makes full contact with the upper teeth or the gum ridge (alveolar ridge) right behind the teeth. This creates a very short vocal tract section in front of the constriction (from the teeth or gum ridge to the lips) and a very long section behind the constriction (from the teeth or gum ridge to the larynx). The length of the section in front of the constriction largely determines which frequency range dominates the spectrum. The shorter this section, the higher the frequency at which most of the energy occurs. That is why front consonants like [t] typically have a concentration of energy above 3,000 Hz while back consonants like [k] have an energy concentration at much lower frequencies, typically between approximately 1,500 and 2,500 Hz. Similarly, as illustrated in Figure 4, the fricative [ʃ] as in the word “she”, produced in the middle of the mouth, has major energy around 2,500 to 3,500 Hz, whereas the major energy for the more anterior [s] occurs well above 4,000 to 5,000 Hz. However, for consonants with a constriction toward the very front of the vocal tract, the front section is too short to really shape the spectrum. As a result, bilabial and labiodental consonants such as [p] and [f], respectively, are described as having diffuse spectra, without any clear concentration of energy, as shown in Figure 5. Cell phones transmit energy between 300 and 3400 Hz. Since fricatives like /s/ and /f/ contain critical information above 3400 Hz they tend to be confused over the phone which is why we add extra clues such as “S as in Sam” or “F as in Frank”.

Examining speech sounds from a linguistic standpoint, a thorough analysis of their frequency, amplitude, and duration can reveal the factors that shape sound categories and phonological processes within and across both languages and generations of speakers. Acoustic phonetic analysis also plays a crucial role in quantifying variations in speech patterns, particularly across dialects and among nonnative speakers or those with specific speech disorders. This analytical approach offers invaluable insights into the diverse acoustic landscapes of speech, aiding in the refinement of targeted interventions and language learning strategies. Beyond academia, the integration of phonetic knowledge with cutting-edge technology holds immense promise. Advanced digital signal processing and machine learning enable in-depth investigations into speech patterns, paving the way for interdisciplinary advancements with implications for psychology, neuroscience, artificial intelligence, and education. From providing insight into the nature of phonological categories and processes to enhancing language pedagogy to revolutionizing speech pathology, Phonetics proves instrumental in enriching our comprehension of human communication and its practical applications.
Further Reading
Fant, G. (1960). Acoustic Theory of Speech Production. The Hague: Mouton.
Flanagan, J. L. (1965). Speech Analysis Synthesis and Perception. Berlin: Springer Verlag.
Hardcastle, W. J., Laver. J., and Gibbon, F. E. (2013). The Handbook of Phonetic Sciences. Oxford: Wiley-Blackwell.
Hillenbrand, J., Getty, L. A., Clark, M. J., and Wheeler, K. (1995). Acoustic characteristics of American English vowels. The Journal of the Acoustical Society of America 97 (5), 3099-3111.
Ladefoged, P. (1996). Elements of Acoustic Phonetics. Chicago: The University of Chicago Press.
Reetz, H., and Jongman, A. (2020). Phonetics: Transcription, Production, Acoustics, and Perception. Oxford: Wiley-Blackwell.
Simões, A. R. M. (2022). Spanish and Brazilian Portuguese Pronunciation - The Mainstream Pronunciation of Spanish and Brazilian Portuguese: From Sound Segments to Speech Melodies. Singapore: Springer, Series: Prosody, Phonology and Phonetics.
Stevens, K. N. (1998). Acoustic Phonetics. Cambridge, MA: MIT Press.